











The 7 Operating Data Points That Help Protect C&I Battery Storage Performance
Release time: 2026-09-14
Commercial and Industrial (C&I) battery storage systems are increasingly critical components of modern energy infrastructure. They offer businesses enhanced energy resilience, reduced peak demand charges, and the ability to integrate renewable energy sources more effectively. However, the financial and operational benefits of these systems are entirely dependent on their sustained performance and health. Unlike simpler electrical equipment, a Battery Energy Storage System (BESS) is a dynamic, electrochemical entity that requires vigilant monitoring.
To ensure long-term viability and maximize return on investment (ROI), operators must move beyond simple plug-and-play mentalities and adopt rigorous data-driven management strategies. Protecting C&I battery storage performance hinges on tracking, analyzing, and acting upon specific operating data points. This article details the seven critical data points that must be continuously monitored to safeguard your energy storage asset.
Table of Contents
1. State of Charge (SOC) Management
The State of Charge (SOC) is perhaps the most fundamental metric for any battery system, representing the current capacity available as a percentage of its total capacity. Think of it as the fuel gauge for your BESS. While it seems straightforward, managing SOC is crucial for battery longevity.
Operating a battery at extreme ends of its SOC—frequently discharging it to 0% or keeping it parked at 100% for extended periods—accelerates degradation mechanisms within the lithium-ion cells. Continuous cycling at high depths of discharge (DoD) significantly reduces the total number of cycles the battery can perform over its lifetime.
How to Protect Performance:
Monitoring the average SOC and the depth of discharge per cycle allows operators to implement optimization strategies. A robust Energy Management System (EMS) should enforce strict SOC limits, keeping daily cycling typically between 20% and 80%, to prevent the battery from entering damaging low-charge states or resting unnecessarily at full charge. Analyzing SOC data over time helps in fine-tuning operational algorithms to balance the immediate need for power delivery against the long-term goal of extending battery life.
2. Cell Temperature Monitoring and Thermal Uniformity
Temperature is the silent killer of battery performance. Lithium-ion batteries operate optimally within a relatively narrow temperature band, typically between 15°C and 35°C (59°F to 95°F).
Elevated temperatures accelerate chemical side reactions within the cells, leading to faster capacity fade and a decline in the State of Health (SOH). Conversely, operating at very low temperatures can cause lithium plating on the anode during charging, which irreversibly damages the cell and poses severe safety risks.
Beyond absolute temperature, thermal uniformity across the entire battery pack is critical. A single hot spot within a module can degrade faster than the surrounding cells. Since a battery pack is only as strong as its weakest cell, significant temperature gradients will lead to premature failure of the entire system.
How to Protect Performance:
Advanced Battery Management Systems (BMS) must track temperatures not just at the macro (enclosure) level, but at the granular cell or module level. Monitoring for temperature deltas between the hottest and coldest cells is vital. This data drives the thermal management system (HVAC or liquid cooling), ensuring it responds dynamically to maintain uniform, optimal conditions. Consistent temperature data tracking allows operators to preemptively identify failing cells or cooling system malfunctions before catastrophic failures occur.
3. Voltage Spreads
A C&I battery system consists of thousands of individual cells connected in series and parallel to achieve the required voltage and capacity. Due to minute manufacturing variances and differences in operating conditions (like the temperature gradients mentioned above), cells will naturally drift in their individual voltages over time.
Voltage spread refers to the difference between the highest and lowest cell voltages within the battery pack. If left unchecked, this imbalance severely restricts the usable capacity of the entire system. During discharge, the system must stop when the lowest-voltage cell hits its minimum threshold, even if other cells have remaining energy. Similarly, charging must cease when the highest-voltage cell reaches its maximum limit.
How to Protect Performance:
Tracking cell voltage spreads is the primary way to verify the effectiveness of the BMS’s cell balancing function. Active or passive balancing circuits work to equalize cell voltages, but they can be overwhelmed by rapidly degrading cells. A consistently widening voltage spread, despite balancing efforts, is a strong early indicator of cell degradation or a localized thermal issue that requires immediate maintenance attention.
Impact of Voltage Imbalance on BESS Operation
| Imbalance Condition | Impact on Performance | BMS Action Required |
| High Voltage Spread during Charge | Reduced total charge capacity; risk of overcharging specific cells. | Initiate top-balancing; reduce charge current. |
| High Voltage Spread during Discharge | Premature system shutdown; stranded energy in healthier cells. | Initiate bottom-balancing (if supported); alert operator to potential weak cell. |
| Increasing Voltage Drift Over Time | Gradual, permanent loss of usable system capacity. | Flag module for inspection or replacement; adjust operating parameters. |
4. Internal Resistance Tracking
Internal resistance, or impedance, is a measure of the opposition to current flow within the battery cell. In a new, healthy battery, internal resistance is very low. However, as the battery ages and undergoes cycling, internal resistance naturally increases due to the growth of the Solid Electrolyte Interphase (SEI) layer and other internal degradation mechanisms.
High internal resistance has a compounding negative effect. First, it causes a voltage drop under load (voltage sag), reducing the actual power output of the system. Second, the energy lost to resistance is converted into heat, which exacerbates thermal management challenges and further accelerates degradation.
How to Protect Performance:
While direct measurement of internal resistance in a live operating environment is complex, it can be calculated or inferred by advanced analytics platforms monitoring voltage sag during known current pulses. Tracking the trend of internal resistance over months and years provides the most accurate picture of the battery’s true State of Health (SOH). A sudden spike in resistance in a specific module indicates a localized failure that warrants immediate investigation.
5. Charge/Discharge Current (C-Rate) Adherence
The rate at which a battery is charged or discharged is denoted by its C-rate. A 1C rate means the battery is fully charged or discharged in one hour. C&I systems are designed for specific C-rates based on their intended application (e.g., high continuous C-rates for frequency regulation vs. longer duration for peak shaving).
Pushing a battery beyond its designated continuous or peak current limits generates excessive heat and accelerates wear on the electrodes. Frequent high-current excursions will drastically shorten the operational life of the asset and may void manufacturer warranties.
How to Protect Performance:
Monitoring the actual operating current against the system’s design specifications is crucial. Data should be analyzed to ensure the EMS is dispatching the battery within safe operating windows. If the data shows frequent, sustained current peaks near or above the design limits, the operator may need to adjust the dispatch algorithms or reconsider if the current system is adequately sized for the load profile it is attempting to serve.
6. Round-Trip Efficiency (RTE) Degradation
Round-Trip Efficiency (RTE) is the ratio of energy retrieved from the battery to the energy put into it during a complete charge-discharge cycle. No system is 100% efficient; energy is always lost to heat (due to internal resistance) and the parasitic loads of auxiliary systems like the BMS and HVAC.
A newly commissioned C&I BESS typically exhibits an RTE between 85% and 90%. Over time, as internal resistance increases and cells degrade, the RTE will naturally decline. However, a sharp or unexpected drop in efficiency is a red flag.
How to Protect Performance:
Continuously calculating and monitoring RTE provides a high-level summary of system health. If the RTE drops faster than the expected degradation curve, it indicates an underlying problem. This could be anything from increased internal resistance in the cells to a failing cooling unit that is drawing excessive auxiliary power. Tracking RTE allows financial models to be updated accurately and triggers investigations into the root causes of efficiency loss.
7. Auxiliary System Power Consumption
A battery storage system is more than just cells and inverters; it relies heavily on auxiliary systems, primarily the thermal management system (HVAC or liquid cooling pumps) and the control electronics.
These auxiliary systems draw power, often parasitically from the battery itself or directly from the grid. In poorly optimized systems or extreme weather conditions, the power consumed by cooling can significantly erode the net energy output and financial returns of the BESS.
How to Protect Performance:
Monitoring the distinct power draw of auxiliary systems is essential for complete performance visibility. If the HVAC system begins drawing significantly more power than historical baselines for a given ambient temperature, it may indicate a dirty filter, low refrigerant, or a failing compressor. Identifying and resolving these inefficiencies quickly ensures that the maximum amount of stored energy is available for its primary commercial purpose, rather than being wasted on keeping the system running.
By diligently tracking and analyzing these seven operating data points, C&I facility managers and energy operators can shift from a reactive maintenance posture to a proactive asset management strategy. This data-driven approach is the only reliable way to safeguard C&I battery storage performance, ensure safety, and guarantee that the battery storage system delivers its promised financial returns over its expected lifespan.
Higre Energy Solution – Higre ESS Stor
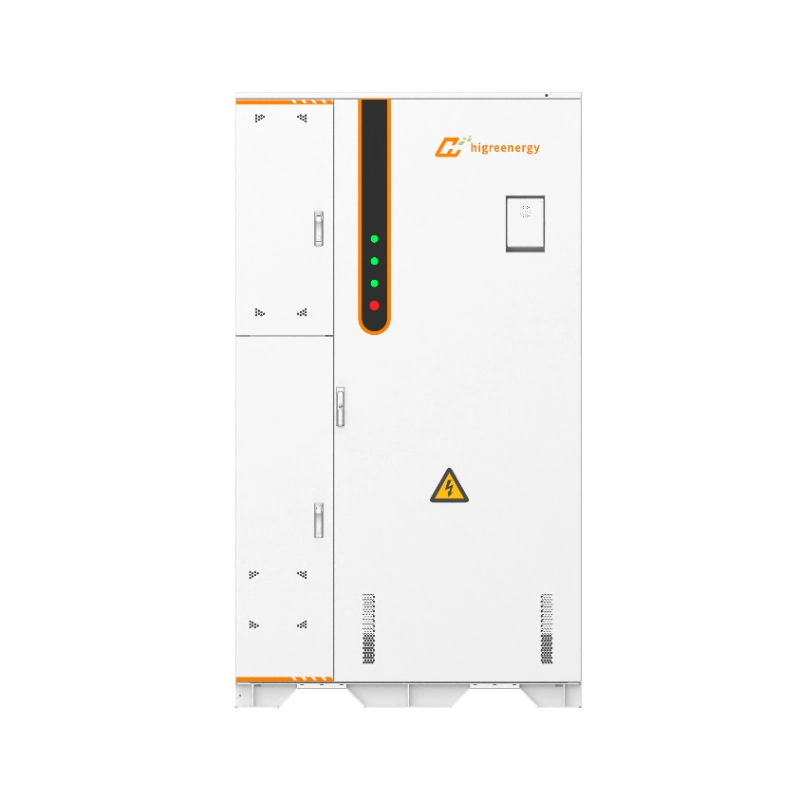
The HGES Stor 261 is a compact, scalable commercial battery energy storage cabinet designed to reduce electricity costs, manage peak demand, and maximize renewable energy utilization. Equipped with advanced lithium technology, an intelligent BMS, and robust safety features, it delivers reliable backup power and energy resilience for commercial and light industrial facilities, whether deployed as a standalone unit or integrated into solar-plus-storage systems.
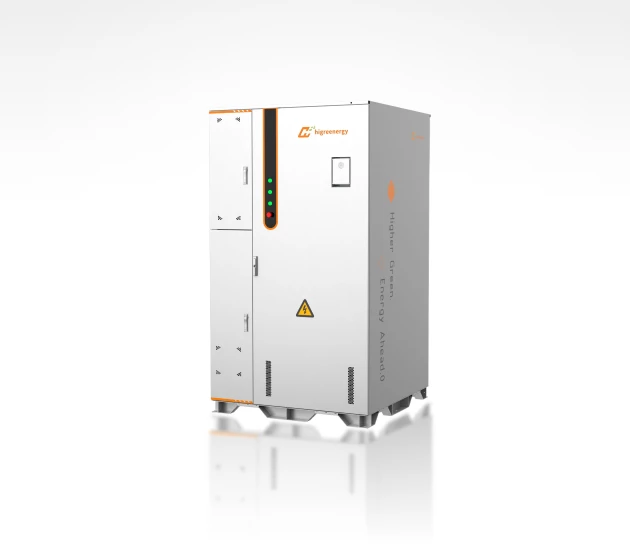
Key Features Ensuring High Asset Availability:
· 261kWh Capacity: Optimized for commercial energy savings.
· Liquid Cooled: Enhanced efficiency and 8,000+ cycle life.
· -35°C to 55°C Operation: Built-in self-heating for extreme weather.
· Smart BMS: Real-time system monitoring (SOC/SOH).
· Ultimate Safety: Integrated fire & thermal protection.
· IP55/IP67 Rating: Rugged outdoor-ready enclosure.
Partner with Higre Energy to secure the technology necessary to exceed performance guarantees and maximize your energy storage ROI.
FAQs
How often should we analyze the data points mentioned, such as State of Charge and Voltage Spreads?
Data collection by the BMS should be continuous (often sub-second intervals). However, analysis for performance protection should be a mix of automated real-time alerts (e.g., if a voltage spread exceeds a critical threshold) and routine trend analysis. A deep dive into trends like internal resistance and RTE should be conducted at least monthly to update SOH models and plan preventative maintenance.
Can we monitor these metrics remotely, or does it require on-site personnel?
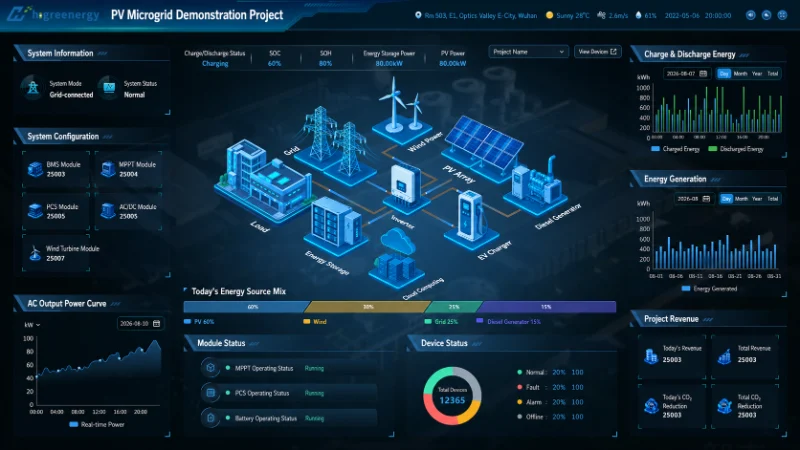
Modern C&I battery systems are equipped with robust remote monitoring and control capabilities. All the critical operating metrics can and should be aggregated into a cloud-based dashboard. This allows operators, asset managers, and even the original equipment manufacturer (OEM) to monitor performance, diagnose issues, and sometimes even push software updates remotely, minimizing the need for constant on-site personnel.
If we notice our Round-Trip Efficiency (RTE) dropping significantly, what is the first step we should take?
A significant drop in RTE requires a systematic investigation. The first step is to isolate the cause: is it internal to the battery (increased cell impedance) or external (high auxiliary loads)? Check the power consumption of the thermal management system first, as a struggling HVAC unit is a common culprit. Concurrently, review the temperature and internal resistance trends of the battery modules. If auxiliary loads are normal, the efficiency loss is likely due to accelerated cell degradation, which may require consultation with the system manufacturer.